
Term 2 | Level 2 | Phonics focus: word endings: -cious, -tious, -cial and -tial
Chapter 4 – Our Changing Earth | Chapters – Index
Lessons
This page has the two viewing and presenting lessons of Chapter 4, Our Changing Earth: Lessons 4.7 and 4.8. The chapter page has the chapter overview, the chapter review and the PDF download.
Tap a lesson to open it. Tap the lesson title again, or use the link at the end of the lesson, to close it.
Lesson 4.7: Read a Cross-Section: Inside a Volcano | Visual | About 20 minutes
Term 2 | Level 2
Goal
“I can read a cross-section diagram, use its labels and key, and explain what it shows.”
Words to know
cross-section, diagram, label, key, crater, vent, magma chamber
Wonder
Think about this question before you start. Say your ideas. You will come back to it at the end of the lesson.
How can we show the inside of something we can never cut open?
Let’s Learn
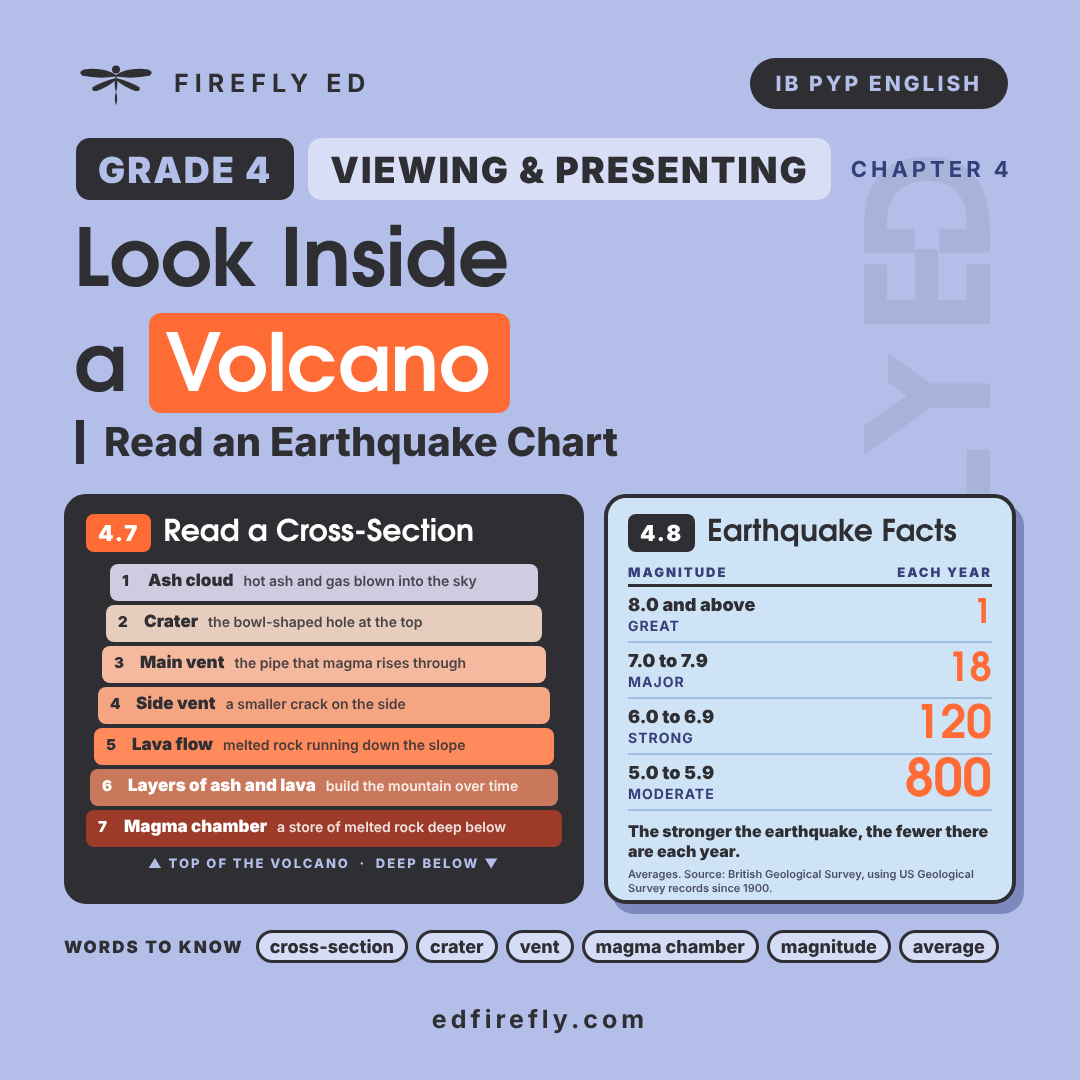
A cross-section is a diagram that shows the inside of something, as if it had been cut in half. Scientists cannot cut a real volcano open, but a cross-section helps us imagine what is under the ground.
To read a cross-section: 1. Read the title or question. 2. Find each number and follow its line to the part it points at. 3. Read the key to find out what each part is. 4. Follow the path of something through the diagram, such as the magma.
See How It’s Done
Now Try It
1. What number shows the crater? ______
2. Where does the magma come from before it rises up the vent?
__________________________________________________________________
Time To Practise
Name: ______________________
1. Use the labels.
Write the name of each part.
3 ______________ 4 ______________ 5 ______________ 7 ______________
2. True or false?
a) The magma chamber is above the ground. ______
b) Lava can come out of a side vent. ______
c) The mountain is built from layers of ash and lava. ______
d) The ash cloud is below the crater. ______
3. Follow the path.
Number these from 1 to 4 to show the path of the magma.
____ main vent ____ lava flow on the slope ____ magma chamber ____ crater
4. Explain.
Why does a volcano get taller after many eruptions? Use the diagram in your answer.
__________________________________________________________________
5. Draw your own.
Draw a cross-section of something else, such as an apple, a hill with a cave, or a layered cake. Add at least four numbered labels and a key.
Reflect
Think about these questions. Talk about them with someone at home or at school.
1. Go back to the Wonder question: “How can we show the inside of something we can never cut open?” What do you think now?
2. I was knowledgeable today when I ______________________________.
Being knowledgeable means knowing things and using what you know. For example: I was knowledgeable today when I named the parts of a volcano using the key.
Take action: Find a cross-section diagram in a science book or at a museum, and explain it to someone at home.
Next Steps
If this was easy, try: Make a model cross-section of a volcano from paper or clay, with labels on small flags.
If this was hard, go back to: Let’s Learn. Point to each number in the diagram and read its name from the key before you start the tasks.
Notes for Parents and Teachers
Show notes for parents and teachers
These notes cover this lesson only. How every lesson runs is explained in How to Use This Material.
Let’s Learn
Then look at the diagram together.
Answer Key
Reveal Answers
Now Try It
1. 2 2. From the magma chamber, deep under the ground.
1. Use the labels
3 main vent 4 side vent 5 lava flow 7 magma chamber
2. True or false?
a) false b) true c) true d) false
3. Follow the path
2 main vent, 4 lava flow on the slope, 1 magma chamber, 3 crater
4. Explain
Sample answer: Each eruption adds a new layer of ash and lava on top of the old ones, as label 6 shows, so the mountain grows taller.
5. Answers will vary. Look for: a cut-open view, at least four numbered labels and a key that matches the numbers.
Reflect
2. Any real moment from the lesson that shows the learner was knowledgeable. Examples: “I was knowledgeable today when I named the parts of a volcano using the key.” “I was knowledgeable today when I explained how a volcano grows taller.”
Lesson 4.8: Read a Table and a Chart: Earthquake Facts | Visual | About 20 minutes
Term 2 | Level 2
Goal
“I can read a table and a bar chart, compare the numbers and explain what they show.”
Words to know
table, column, row, bar chart, axis, magnitude, average
Wonder
Think about this question before you start. Say your ideas. You will come back to it at the end of the lesson.
Do you think big earthquakes happen often or rarely? How could you find out?
Let’s Learn
Scientists measure the strength of an earthquake with a number called its magnitude. A bigger number means a much stronger earthquake. Instruments around the world record every shake, so scientists can count how many earthquakes of each size happen in a year.
A table shows information in rows and columns. Read across a row to find all the facts about one thing.
| Magnitude | Name | Average number each year |
|---|---|---|
| 8.0 and above | Great | 1 |
| 7.0 to 7.9 | Major | 18 |
| 6.0 to 6.9 | Strong | 120 |
| 5.0 to 5.9 | Moderate | 800 |
Source: British Geological Survey, using US Geological Survey records since 1900. The numbers are averages, so some years have more and some have fewer.
A bar chart shows numbers as bars, so you can compare them quickly. Read the label under each bar, then read across from the top of the bar to the numbers on the side (the axis).
See How It’s Done
Now Try It
1. How many great earthquakes happen in an average year? ______
2. Which is shown in the table but not in the chart?
__________________________________________________________________
Hint: Count the rows and the bars.
Time To Practise
Name: ______________________
1. Read the table.
a) What is the name for an earthquake of magnitude 6.0 to 6.9? ______________
b) How many moderate earthquakes happen in an average year? ______________
2. Read the chart.
a) Which bar is the tallest? ______________ b) What does the tallest bar show? ______________
3. Compare.
a) How many more strong earthquakes than major earthquakes happen each year? ______________
b) Are great earthquakes common or rare? How do you know? ______________________________
4. Table or chart?
Which is better for finding an exact number? Which is better for seeing the pattern quickly? Explain.
__________________________________________________________________
5. The pattern.
Complete the sentence: The stronger an earthquake is, the ________________________.
Reflect
Think about these questions. Talk about them with someone at home or at school.
1. Go back to the Wonder question: “Do you think big earthquakes happen often or rarely? How could you find out?” What do you think now?
2. I was a thinker today when I ______________________________.
A thinker thinks carefully to work things out. For example: I was a thinker today when I checked that the table and the chart showed the same numbers.
Take action: Find a table or chart in a newspaper or on a weather report. Tell someone what it shows and one pattern you notice.
Next Steps
If this was easy, try: Make your own bar chart from the table, including the moderate earthquakes. Think about how tall the axis must be.
If this was hard, go back to: Let’s Learn. Read one row of the table aloud at a time, then find the matching bar on the chart.
Notes for Parents and Teachers
Show notes for parents and teachers
These notes cover this lesson only. How every lesson runs is explained in How to Use This Material.
Let’s Learn
Look at the table and the chart together.
Answer Key
Reveal Answers
Now Try It
1. 1 2. The moderate earthquakes (magnitude 5.0 to 5.9, about 800 a year) are in the table but not in the chart.
1. Read the table
a) Strong b) about 800
2. Read the chart
a) the bar for 6.0 to 6.9 b) about 120 strong earthquakes happen each year
3. Compare
a) 102 (120 − 18) b) Rare. There is only about 1 a year, and its bar is the shortest.
4. Table or chart?
Sample answer: The table is better for exact numbers, because you can read them directly. The chart is better for seeing the pattern, because you can compare the heights of the bars at a glance.
5. The pattern
Sample answer: the less often it happens.
Reflect
2. Any real moment from the lesson that shows the learner was a thinker. Examples: “I was a thinker today when I checked that the table and the chart showed the same numbers.” “I was a thinker today when I found a pattern in the data.”
For Teachers: IB Details
Show IB and curriculum details
IB theme: How the world works. This theme is about the natural world and its laws, how people and nature affect each other, and how people use science to understand the world.
Central idea: Forces inside the Earth and on its surface change the land, and people can prepare for those changes.
| Lesson | Title | Strand | Key concept |
|---|---|---|---|
| 4.7 | Read a Cross-Section: Inside a Volcano | Viewing | Form |
| 4.8 | Read a Table and a Chart: Earthquake Facts | Viewing | Causation |
Each lesson also matches the national curriculum for England (Year 4) and the US Common Core (Grade 4). The Grade 4 Curriculum Map lists the full standards for every lesson.
← Back to Chapter 4 – Our Changing Earth | Chapters – Index
© 2026 Firefly Ed. All rights reserved. This page may be printed for personal, home and classroom use. It may not be sold, shared online or reproduced for commercial use without written permission. edfirefly.com



Share your thoughts or ask something..