
Term 3 | Level 3 | Phonics focus: prefixes un-, re- and dis-, three-syllable words, and a review of the year’s tricky words
Lesson 9 – Caring for Our Planet | Lessons – Index
Lessons
This page has the two viewing and presenting lessons of Lesson 9, Caring for Our Planet: Lessons 9.7 and 9.8. The Lesson 9 page has the Lesson 9 overview, the Lesson 9 review and the PDF download.
Select a lesson to go straight to it. Each lesson ends with a link back to the top of the page.
Lesson 9.7: Read an Infographic: Water We Use
Visual | About 20 minutes
Term 3 | Level 3
Goal
“I can read an infographic using its title, icons, numbers and key, compare amounts and explain how the design helps the message.”
Words to know
infographic, icon, key, litre, compare, message
Wonder
Think about this question before you start. Say your ideas. You will come back to it at the end of the lesson.
How much water do you use in one day?
Let’s Learn
An infographic shows information as a mix of pictures, numbers and a few words. It is designed so you can understand the main facts in a few seconds.
| Feature | What it does |
|---|---|
| title | tells you the topic |
| icons | small, simple pictures that stand for things |
| big numbers | the most important facts, easy to spot |
| a key | tells you what a symbol means, for example 1 drop = about 5 litres |
| a message | often at the bottom: what the maker wants you to do |
A litre is a measure of liquid. A large bottle of water from a shop often holds 1 or 2 litres.
See How It’s Done
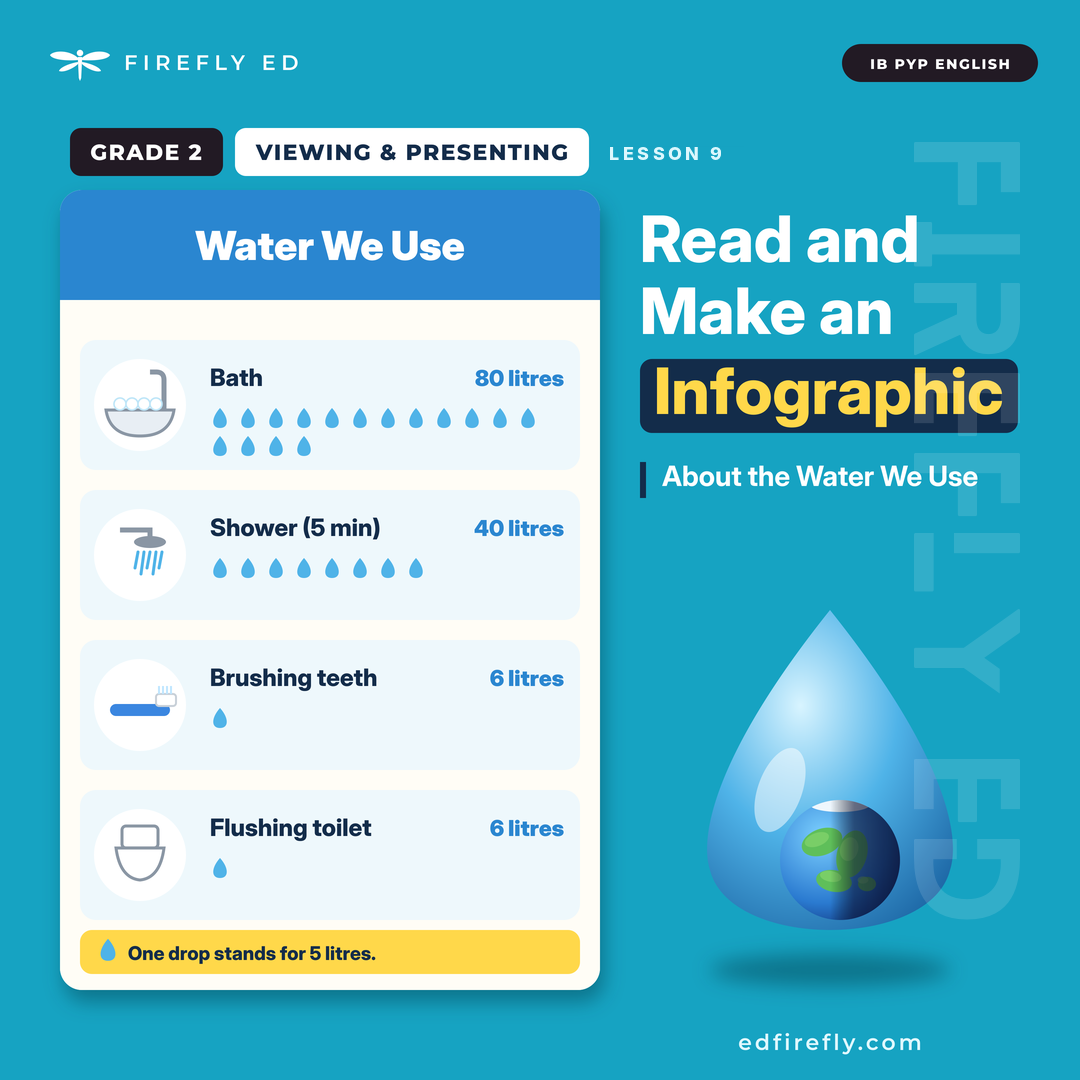
The numbers in this infographic come from Northern Ireland Water.
Now Try It
Use the infographic in See How It’s Done.
1. How many litres does one toilet flush use?
Hint: Look for the big blue number in that row.
2. How many drops are in the shower row?
Hint: Count them, then check with the key.
Time To Practise
Name: ______________________
1. Read the infographic.
a) Which activity uses the most water? ______________
b) Which activity uses the least water? ______________
c) How much water does a 5-minute shower use? ______ litres
d) What does one drop stand for? ______________
2. Compare and work it out.
a) How much more water does a bath use than a 5-minute shower? ______ litres
Hint: 80 take away 35.
b) Leo brushes his teeth for 2 minutes with the tap running, twice a day. How many litres is that each day? ______ litres
c) Is it better for the planet to have a bath or a 5-minute shower? Explain using the numbers.
__________________________________________________________________
3. Think about the design.
a) Why do you think the maker used drops as well as numbers?
__________________________________________________________________
b) Why is the title at the top, in big white letters?
__________________________________________________________________
c) What does the infographic want you to do? Will you do it? Why?
__________________________________________________________________
4. Water detective.
For one day, keep a tally of how many times your family uses each of these: bath, shower, toilet flush, tap for brushing teeth. Which uses the most water in your home?
| Activity | Tally |
|---|---|
| bath | ______________ |
| shower | ______________ |
| toilet flush | ______________ |
| brushing teeth | ______________ |
Reflect
Think about these questions. Talk about them with someone at home or at school.
1. Go back to the Wonder question: “How much water do you use in one day?” What do you think now?
2. I was a thinker today when I ______________________________.
A thinker thinks carefully to work things out. For example: I was a thinker today when I used the numbers to compare a bath and a shower.
Take action: Time your next shower. Can you keep it to 5 minutes? Turn off the tap every time you brush your teeth this week.
Next Steps
If this was easy, try: Find out with an adult how much water a washing machine or a dishwasher uses. Add a new row to the infographic.
If this was hard, go back to: Task 1. Answer a) and b) by counting the drops in each row first. Then find the numbers.
Notes for Parents and Teachers
Show notes for parents and teachers
These notes cover this lesson only. How every lesson runs is explained in How to Use This Material.
Let’s Learn
Find a 1-litre or 2-litre bottle at home to see how much a litre is.
See How It’s Done
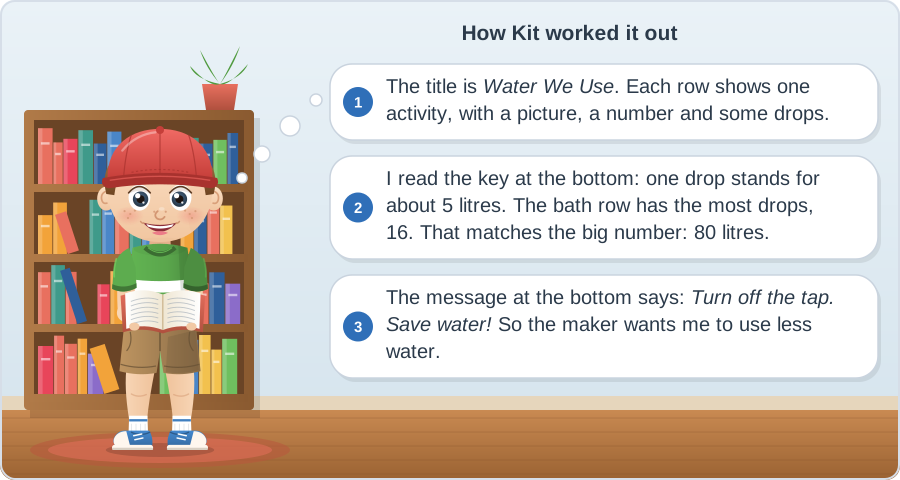
As you go through Kit’s thoughts, count the drops in the bath row together.
Answer Key
Reveal Answers
Now Try It
1. 6 litres
2. 7 drops
1. Read
a) a bath
b) one toilet flush
c) 35
d) about 5 litres
2. Compare
a) 45
b) 24 (12 + 12)
c) A 5-minute shower, because it uses 35 litres and a bath uses 80 litres. That saves 45 litres.
3. Design
Sample answers:
a) So you can see the difference at a glance, without reading the numbers. The bath row is much longer.
b) So it stands out and you know the topic straight away.
c) Turn off the tap and save water. Yes, because it is easy and it saves a lot of water.
4. Water detective
Look for: a tally for each activity, and a sensible answer using the numbers from the infographic.
Reflect
2. Any real moment from the lesson that shows the learner was a thinker. Examples: “I was a thinker today when I used the numbers to compare a bath and a shower.” “I was a thinker today when I worked out how much water I use.”
Lesson 9.8: Make an Infographic
Visual | About 20 minutes
Term 3 | Level 3
Goal
“I can turn facts into an infographic with a title, icons, big numbers, a few words, matching colours and a message.”
Words to know
infographic, icon, big number, layout, colour, message
Wonder
Think about this question before you start. Say your ideas. You will come back to it at the end of the lesson.
How can you make facts easy to understand in five seconds?
Let’s Learn
In Lesson 9.7, you read an infographic. Now you will make one. An infographic turns facts into something people can understand at a glance.
How to make an infographic:
- Choose a short, clear title.
- Pick the most important number from each fact and make it big.
- Draw a simple icon for each fact. Keep it simple: a can, a bottle, an apple core.
- Use only a few words. Cut every word you do not need.
- Choose a few colours that go together, and use them the same way every time.
- Add a message at the bottom: what should people do?
Test it: show it to someone for five seconds, then hide it. What do they remember?
See How It’s Done
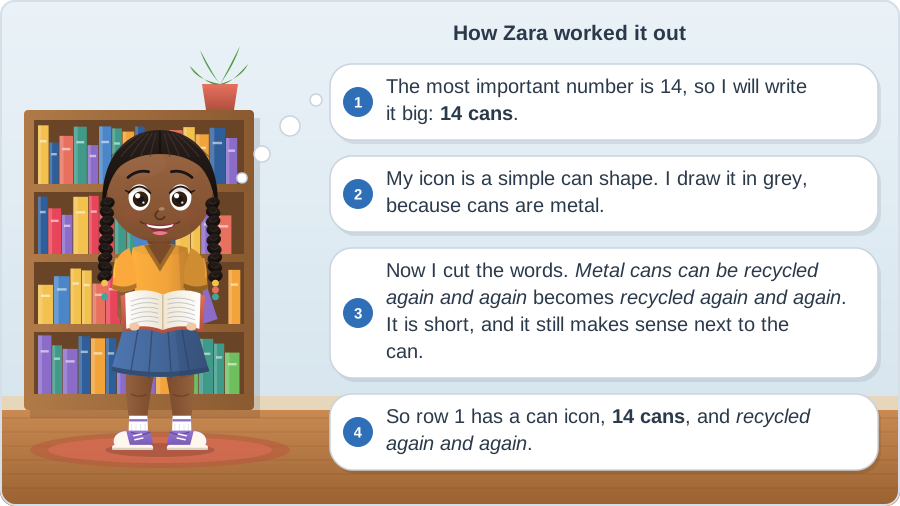
Fact 1: Mia’s family recycled 14 metal cans in one week. Metal cans can be recycled again and again.
Now Try It
1. Cut this fact to five words or fewer: Food waste can be turned into compost.
Hint: Which words could you take out and still understand?
2. What simple icon could you draw for paper and card?
Hint: Think of something flat that you can draw in a few seconds.
Time To Practise
Name: ______________________
1. Read the facts.
| Mia’s family: recycling in one week | ||
|---|---|---|
| 1 | 14 metal cans | Metal cans can be recycled again and again. |
| 2 | 9 glass jars and bottles | Glass can be melted and made into new jars and bottles. |
| 3 | 20 pieces of paper and card | Paper can be recycled several times to make new paper. |
| 4 | 6 plastic bottles | Plastic bottles can be made into new bottles, or even into clothes. |
| 5 | 3 kilograms of food waste | Food waste can be turned into compost. |
2. Plan each row.
| Row | Icon | Big number | A few words |
|---|---|---|---|
| 1 | can | 14 cans | recycled again and again |
| 2 | __________ | __________ | ______________________ |
| 3 | __________ | __________ | ______________________ |
| 4 | __________ | __________ | ______________________ |
| 5 | __________ | __________ | ______________________ |
Title: ______________________________ Message: ______________________________
My colours: ______________________________
3. Make your infographic.
Use the plan below, or a big sheet of paper.
Check your work. Tick each one you did.
☐ a clear title ☐ five rows ☐ a simple icon in each row ☐ big numbers ☐ only a few words ☐ colours used the same way ☐ a message at the bottom
4. The five-second test.
Show your infographic to someone for five seconds, then hide it. Ask: What do you remember?
What did they remember? ______________________________________________
What would you change to make it clearer? ______________________________________________
Reflect
Think about these questions. Talk about them with someone at home or at school.
1. Go back to the Wonder question: “How can you make facts easy to understand in five seconds?” What do you think now?
2. I was a communicator today when I ______________________________.
A communicator shares ideas clearly by talking, writing or drawing. For example: I was a communicator today when I cut every word I did not need.
Take action: Count your own family’s recycling for one week, and make an infographic with your real numbers. Put it next to your bins.
Next Steps
If this was easy, try: Make a second infographic about the energy you use at home, such as how many lights or screens are on at one time. Count them first.
If this was hard, go back to: Task 3. Make an infographic with three rows only: cans, glass and food waste. Use the plan from Task 2.
Notes for Parents and Teachers
Show notes for parents and teachers
These notes cover this lesson only. How every lesson runs is explained in How to Use This Material.
Let’s Learn
Look back at the infographic in Lesson 9.7 and find each feature.
See How It’s Done
Draw the can icon on paper as you go through Zara’s thoughts.
Time To Practise
- Task 3: Check the learner’s work together, and tick each one you see.
Answer Key
Reveal Answers
Now Try It
1. Sample answer: food waste makes compost
2. Sample answer: a sheet of paper with lines, or a folded box.
2. Plan
Sample answers:
2. jar | 9 glass jars and bottles | melted into new ones
3. sheet of paper | 20 pieces of paper and card | made into new paper
4. bottle | 6 plastic bottles | new bottles or clothes
5. apple core | 3 kg food waste | turned into compost
Title: What Mia’s Family Recycled in One Week Message: Recycle more. Waste less!
3. Infographic
Look for: five or more ticks.
4. Five-second test
Answers will vary. If they remembered the title and at least one big number, the infographic is working.
Reflect
2. Any real moment from the lesson that shows the learner was a communicator. Examples: “I was a communicator today when I cut every word I did not need.” “I was a communicator today when I tested my infographic on someone else.”
For Teachers: IB Details
Show IB and curriculum details
IB theme: Sharing the planet. This theme is about our rights and responsibilities, how we share the Earth’s resources with other people and living things, and how we can look after them.
Central idea: People’s actions affect the planet, and we can make choices that help to protect it.
| Lesson | Title | Strand | Key concept |
|---|---|---|---|
| 9.7 | Read an Infographic: Water We Use | Viewing | Responsibility |
| 9.8 | Make an Infographic | Viewing and presenting | Connection |
Each lesson also matches the national curriculum for England (Year 2) and the US Common Core (Grade 2). The Grade 2 Curriculum Map lists the full standards for every lesson.
← Back to Lesson 9 – Caring for Our Planet | Lessons – Index
© 2026 Firefly Ed. All rights reserved. This page may be printed for personal, home and classroom use. It may not be sold, shared online or reproduced for commercial use without written permission. edfirefly.com


Share your thoughts or ask something..