

Term 3 | Level 3 | Phonics focus: the roots therm, hydro, bio and eco, and ei after c
Lesson 8 – Energy for Our Planet | Lessons – Index
Lessons
This page has the two viewing and presenting lessons of Lesson 8, Energy for Our Planet: Lessons 8.7 and 8.8. The Lesson 8 page has the Lesson 8 overview, the Lesson 8 review and the PDF download.
Select a lesson to go straight to it. Each lesson ends with a link back to the top of the page.
- Lesson 8.7: Read a Pie Chart and a Bar Chart: Where Electricity Comes From
- Lesson 8.8: Keep an Energy Diary and Make a Chart
Lesson 8.7: Read a Pie Chart and a Bar Chart: Where Electricity Comes From
Visual | About 20 minutes
Term 3 | Level 3
Goal
“I can read a pie chart and a bar chart and explain what each one shows.”
Words to know
pie chart, bar chart, percentage, whole, part, key, compare
Wonder
Think about this question before you start. Say your ideas. You will come back to it at the end of the lesson.
Why might we use a pie chart for some information and a bar chart for other information?
Let’s Learn
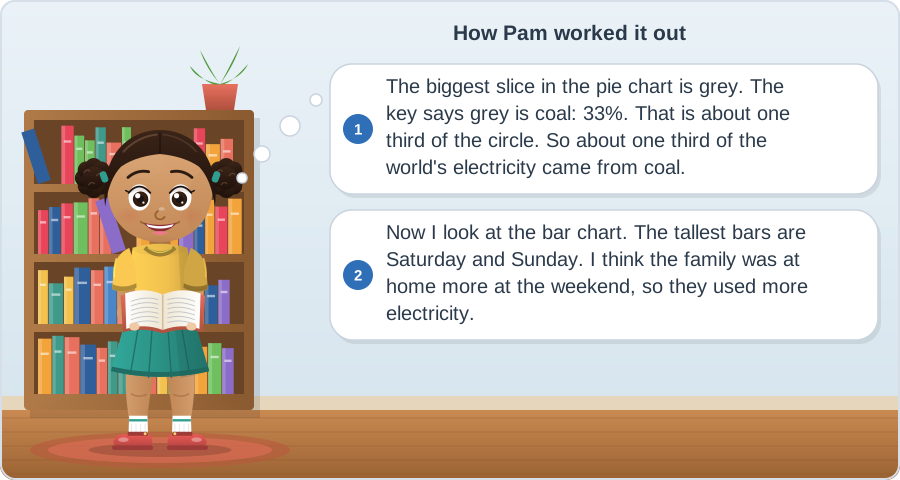
A pie chart shows how a whole is split into parts. The whole circle is 100 per cent (100%). The bigger the slice, the bigger the part. A key tells you what each colour means.
A bar chart compares amounts. It is good for showing how something changes, such as electricity use on different days.
See How It’s Done
Now Try It
1. Which source made 14% of the world’s electricity? ______________
2. On which day did the family use the least electricity? ______________
Time To Practise
Name: ______________________
1. Read the pie chart.
a) Which source made the most electricity? ______________ b) What percentage came from wind? ______________
c) Wind and solar together made ______% d) Which made more: hydro or wind? ______________
2. Think about it.
Coal and gas both release carbon dioxide. What percentage of the world’s electricity came from coal and gas together? ______%
3. Read the bar chart.
a) How many units did the family use on Wednesday? ______ b) How many more units on Sunday than on Monday? ______
c) What was the total for the whole week? ______
4. Which chart?
Would you use a pie chart or a bar chart for each one? Write P or B.
a) How a class spends its pocket money (the parts of the whole) ____ b) The rainfall in each month ____ c) The number of books read by four friends ____
5. Explain.
Write two sentences: one that tells what the pie chart shows, and one that tells what the bar chart shows.
__________________________________________________________________
__________________________________________________________________
Reflect
Think about these questions. Talk about them with someone at home or at school.
1. Go back to the Wonder question: “Why might we use a pie chart for some information and a bar chart for other information?” What do you think now?
2. I was a thinker today when I ______________________________.
A thinker thinks carefully to work things out. For example: I was a thinker today when I used the key to read a pie chart.
Take action: Look at your home electricity meter or bill with an adult. Find out how many units your family used last month.
Next Steps
If this was easy, try: Find out where your own country’s electricity comes from, using a trusted source, and draw a pie chart.
If this was hard, go back to: Let’s Learn. Cover the key. Point to each slice and guess what it is, then check with the key.
Notes for Parents and Teachers
Show notes for parents and teachers
These notes cover this lesson only. How every lesson runs is explained in How to Use This Material.
Let’s Learn
Read Let’s Learn aloud together. Look at each chart together.
Answer Key
Reveal Answers
Now Try It
1. hydro 2. Tuesday or Thursday (7 units each)
1. Read the pie chart
a) coal b) 8% c) 17% d) hydro
2. 55%
3. Read the bar chart
a) 9 b) 5 c) 64
4. Which chart?
a) P b) B c) B
5. Sample answers: The pie chart shows that more than half of the world’s electricity in 2025 came from coal and gas. The bar chart shows that the family used the most electricity at the weekend.
Reflect
2. Any real moment from the lesson that shows the learner was a thinker. Examples: “I was a thinker today when I used the key to read a pie chart.” “I was a thinker today when I compared amounts on a bar chart.”
Lesson 8.8: Keep an Energy Diary and Make a Chart
Visual | About 20 minutes
Term 3 | Level 3
Goal
“I can record information in a diary, organise it in a table and present it in a bar chart.”
Words to know
diary, record, tally, data, bar chart, conclusion
Wonder
Think about this question before you start. Say your ideas. You will come back to it at the end of the lesson.
How many things in your home use electricity in one day?
Let’s Learn
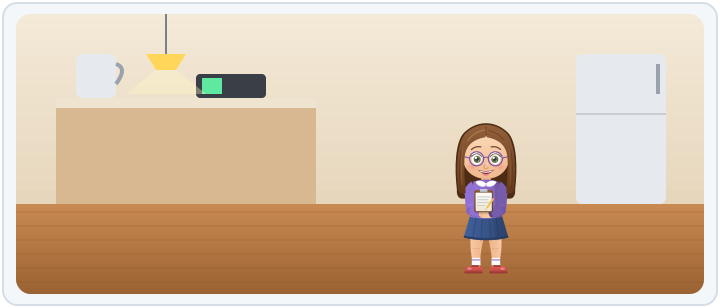
Scientists record what they notice so they can look for patterns later. An energy diary records what is switched on, and when. You can then turn your data into a bar chart and write a conclusion: what the chart shows you.
See How It’s Done
Now Try It
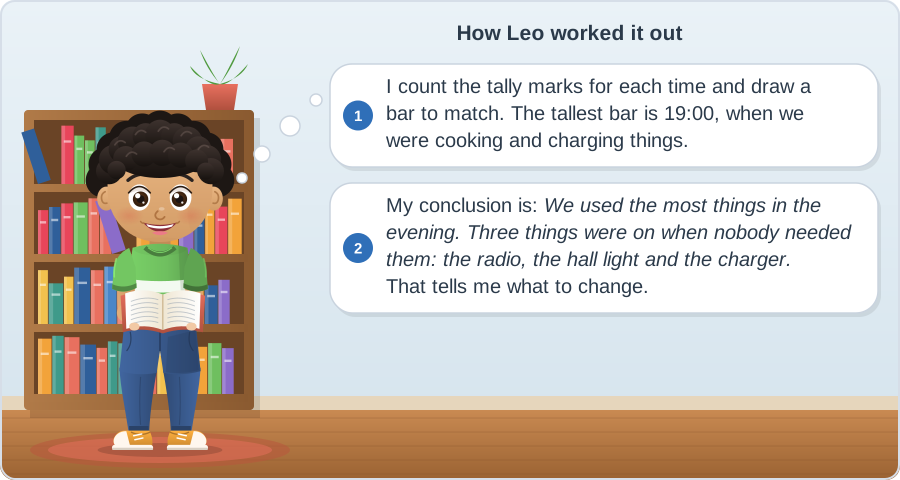
1. At what time were the most things switched on? ______________
2. Which things were not needed? ______________________________
Time To Practise
Name: ______________________
1. Keep your diary.
For one day, record what is switched on in your home at five different times.
| Time | What was switched on | Needed? | Tally |
|---|---|---|---|
2. Make your chart.
On paper, draw a bar chart of your tallies. Add a title, labels under the bars and a scale up the side.
3. Write a conclusion.
What does your chart show? When were the most things on? What was on that did not need to be?
__________________________________________________________________
__________________________________________________________________
4. Suggest a change.
Write one change your family could make, based on your data.
__________________________________________________________________
Reflect
Think about these questions. Talk about them with someone at home or at school.
1. Go back to the Wonder question: “How many things in your home use electricity in one day?” What do you think now?
2. I was an inquirer today when I ______________________________.
An inquirer asks questions and finds things out. For example: I was an inquirer today when I collected my own data carefully.
Take action: Share your chart with your family and agree on one change. Keep the diary again next week to see if it worked.
Next Steps
If this was easy, try: Keep the diary for three days and draw a chart that compares the days.
If this was hard, go back to: Let’s Learn. Copy Mia’s first two rows into your own table before you start your diary.
Notes for Parents and Teachers
Show notes for parents and teachers
These notes cover this lesson only. How every lesson runs is explained in How to Use This Material.
Let’s Learn
Read Let’s Learn aloud together. Look at Mia’s diary and chart together.
Answer Key
Reveal Answers
Now Try It
1. 19:00 2. the radio, the hall light and the charger left on
1 to 4. Answers will vary. Look for: five recorded times with tallies, a bar chart with a title, labels and an even scale, a conclusion that uses the data, and a sensible change.
Reflect
2. Any real moment from the lesson that shows the learner was an inquirer. Examples: “I was an inquirer today when I collected my own data carefully.” “I was an inquirer today when I used my chart to suggest a change.”
For Teachers: IB Details
Show IB and curriculum details
IB theme: Sharing the planet. This theme is about the rights and responsibilities we have as we share the planet’s resources with other people and other living things.
Central idea: People get energy from different sources, and the choices we make about energy affect the planet and everyone who shares it.
| Lesson | Title | Strand | Key concept |
|---|---|---|---|
| 8.7 | Read a Pie Chart and a Bar Chart: Where Electricity Comes From | Viewing | Causation |
| 8.8 | Keep an Energy Diary and Make a Chart | Presenting | Responsibility |
Each lesson also matches the national curriculum for England (Year 4) and the US Common Core (Grade 4). The Grade 4 Curriculum Map lists the full standards for every lesson.
← Back to Lesson 8 – Energy for Our Planet | Lessons – Index
© 2026 Firefly Ed. All rights reserved. This page may be printed for personal, home and classroom use. It may not be sold, shared online or reproduced for commercial use without written permission. edfirefly.com


Share your thoughts or ask something..